I'm studying Computer Science with a focus on data analytics. For the past year, I've been working
as a Data Analyst Intern where I've built interactive dashboards in Power BI, developed Python scripts
to automate data pipelines, and turned messy datasets into actionable insights. I'm proficient in Python,
SQL, and Power BI, with hands-on experience cleaning data, performing statistical analysis, and creating
visualizations that help people make decisions.
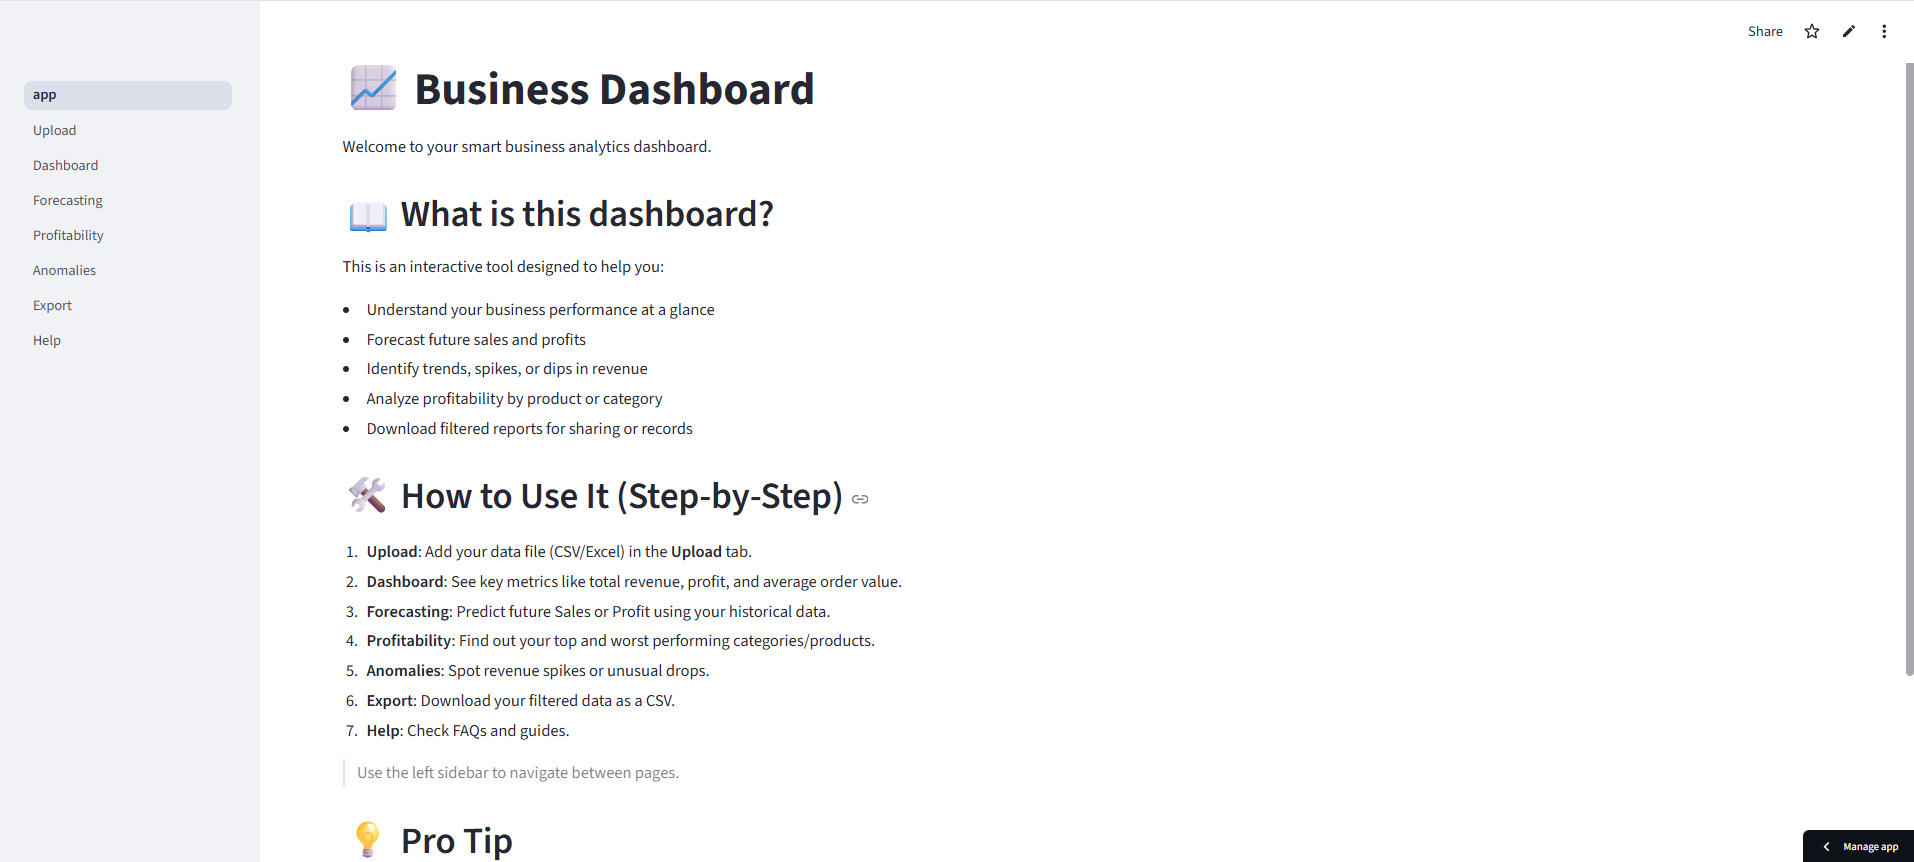
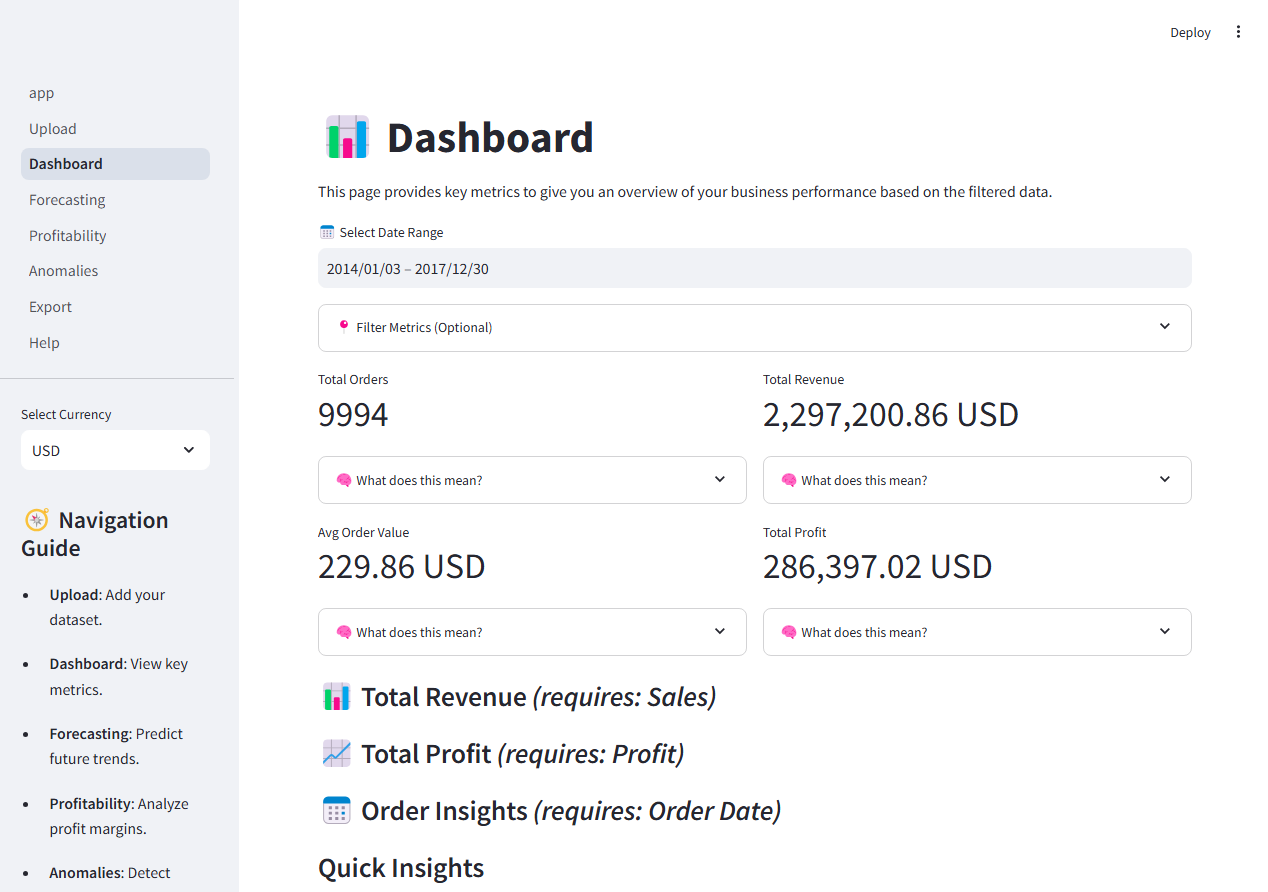
I've built multiple end-to-end analytics projects from scratch, including a Business Dashboard with time-series
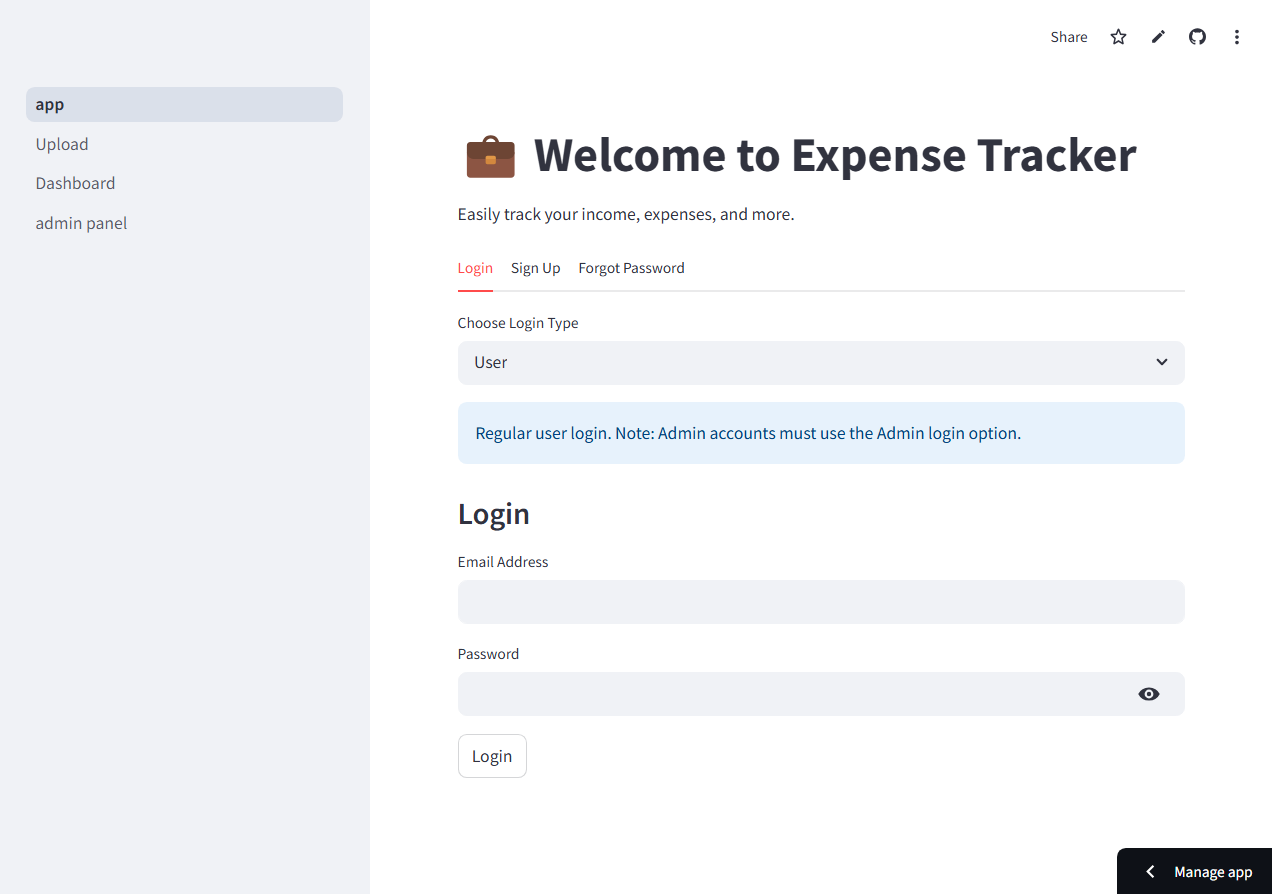
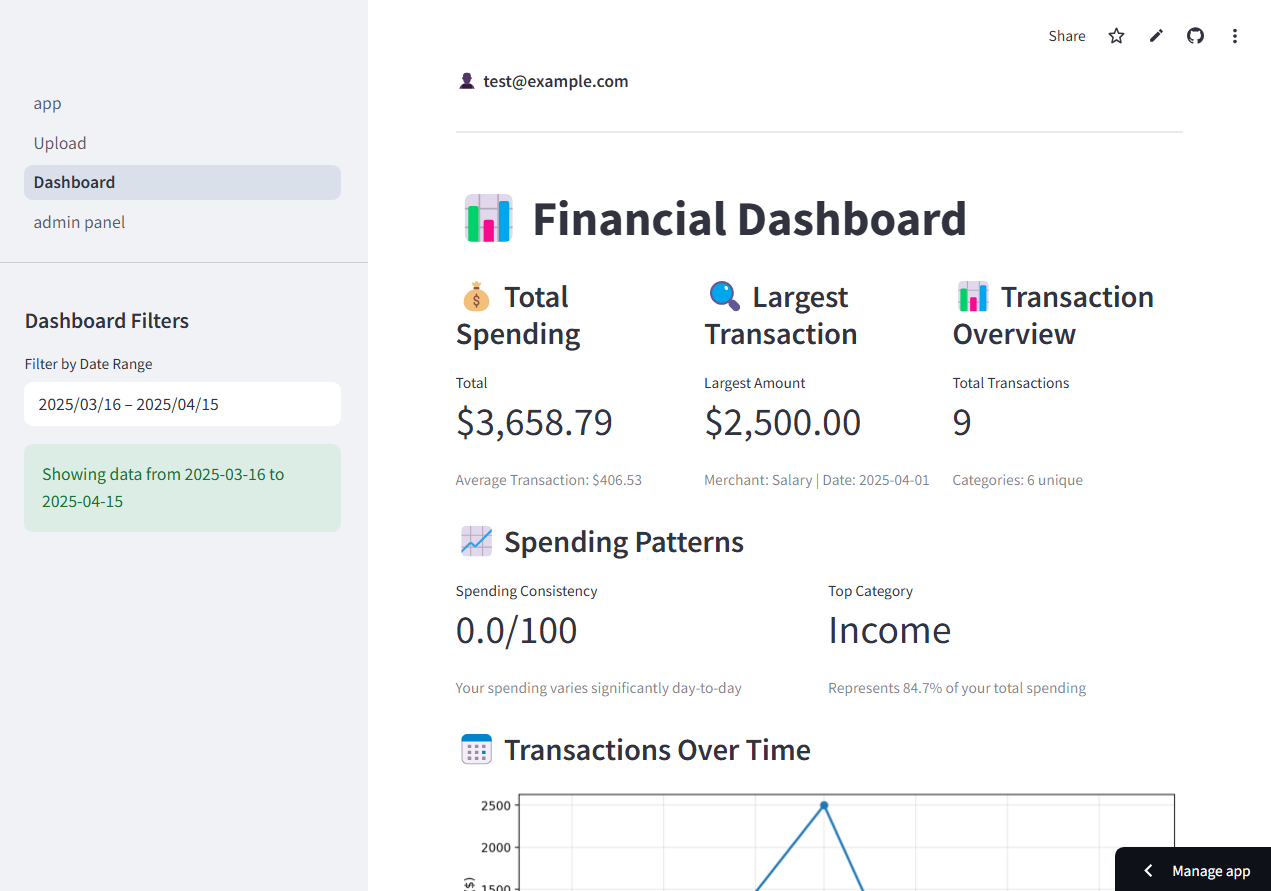
forecasting using Facebook Prophet, an Expense Tracker Dashboard that handles multi-format data imports and
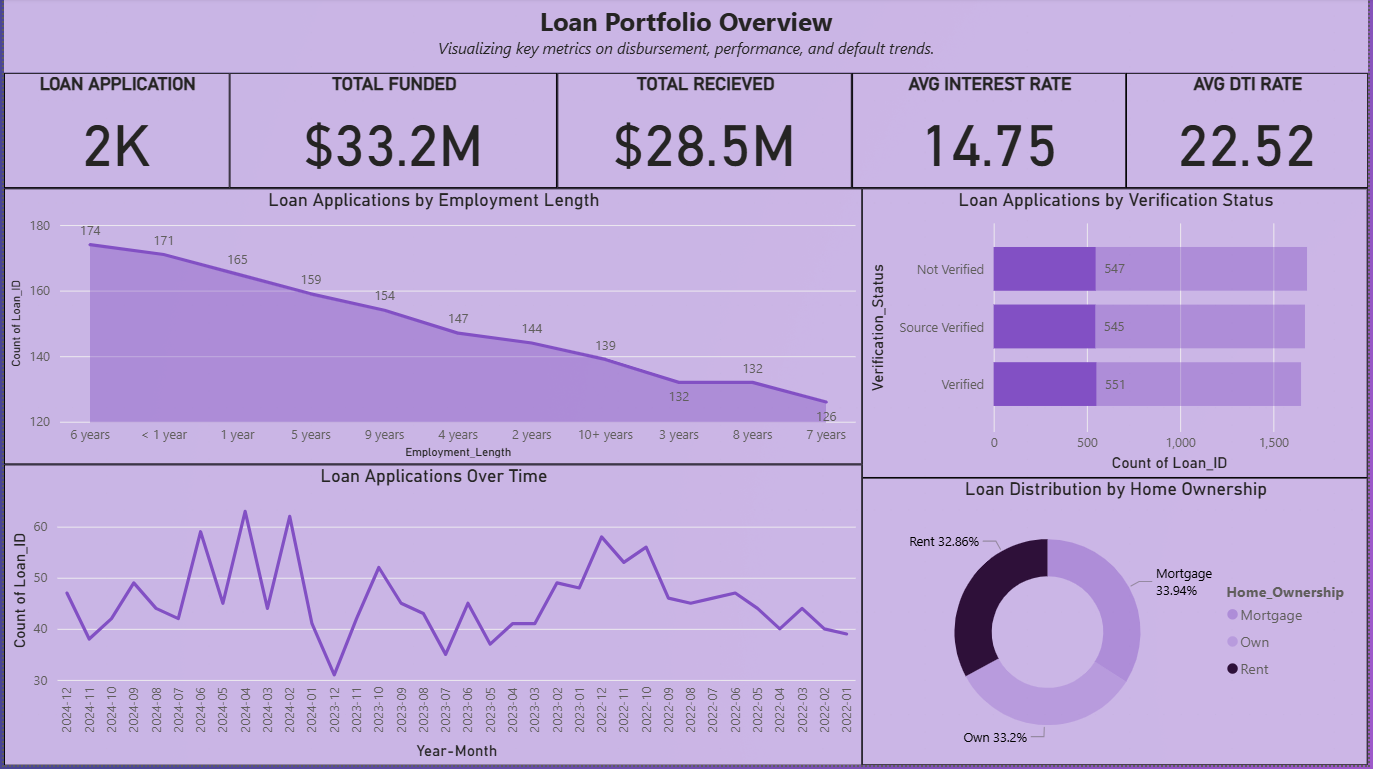
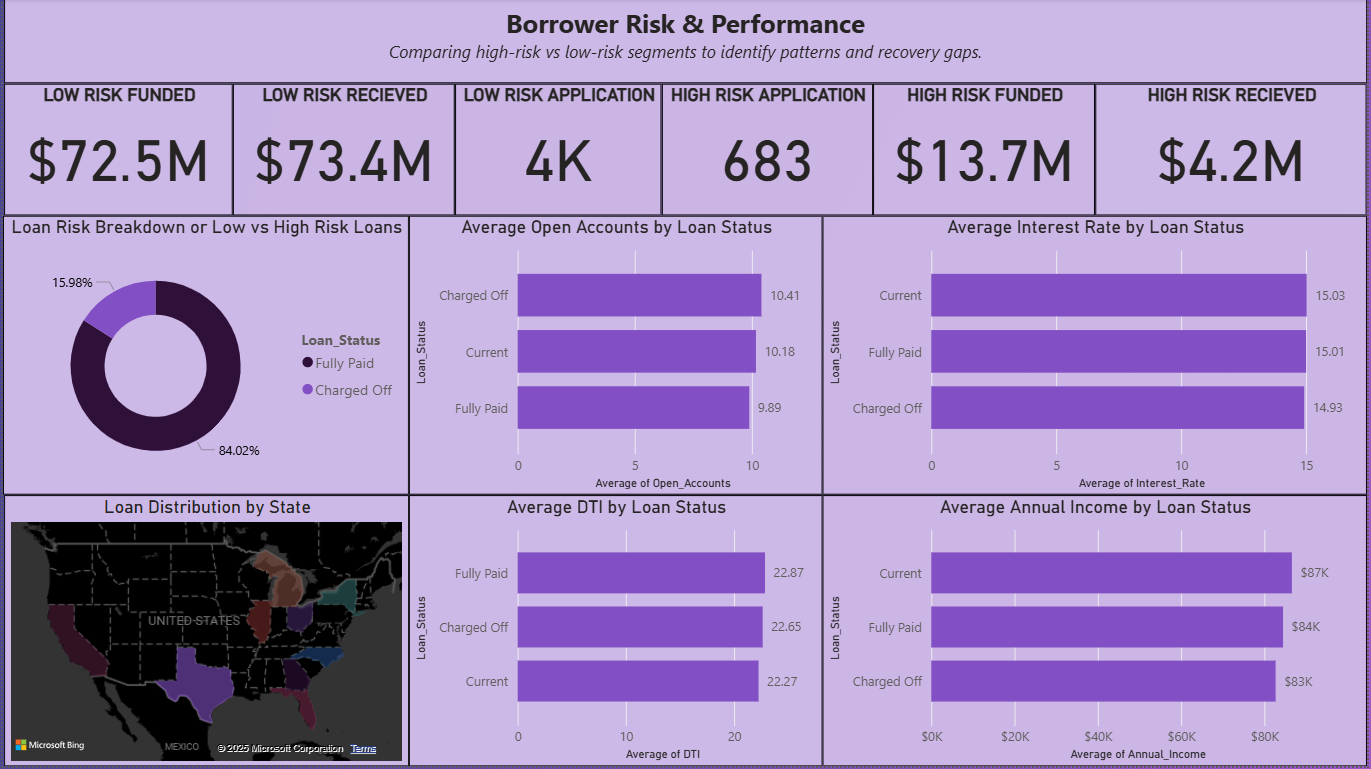
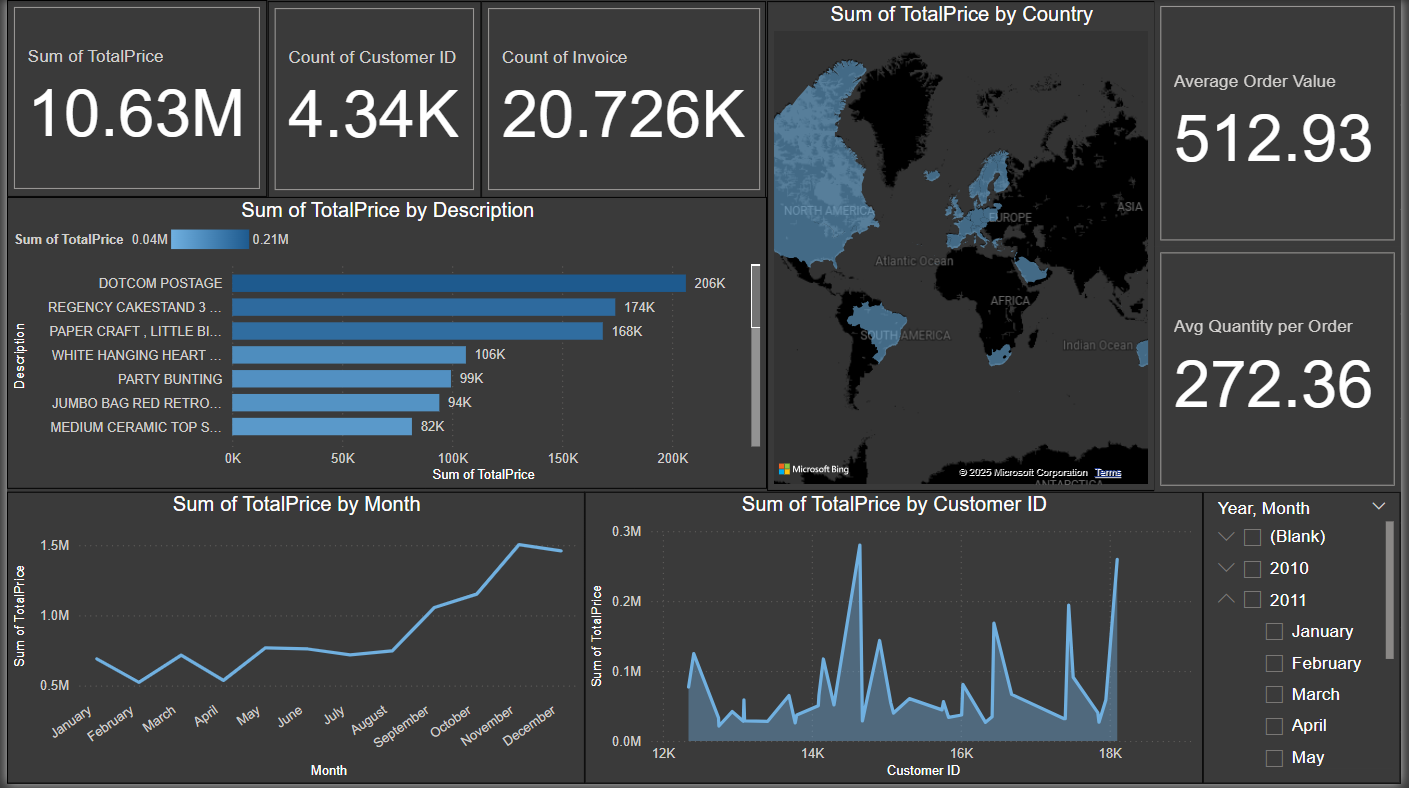
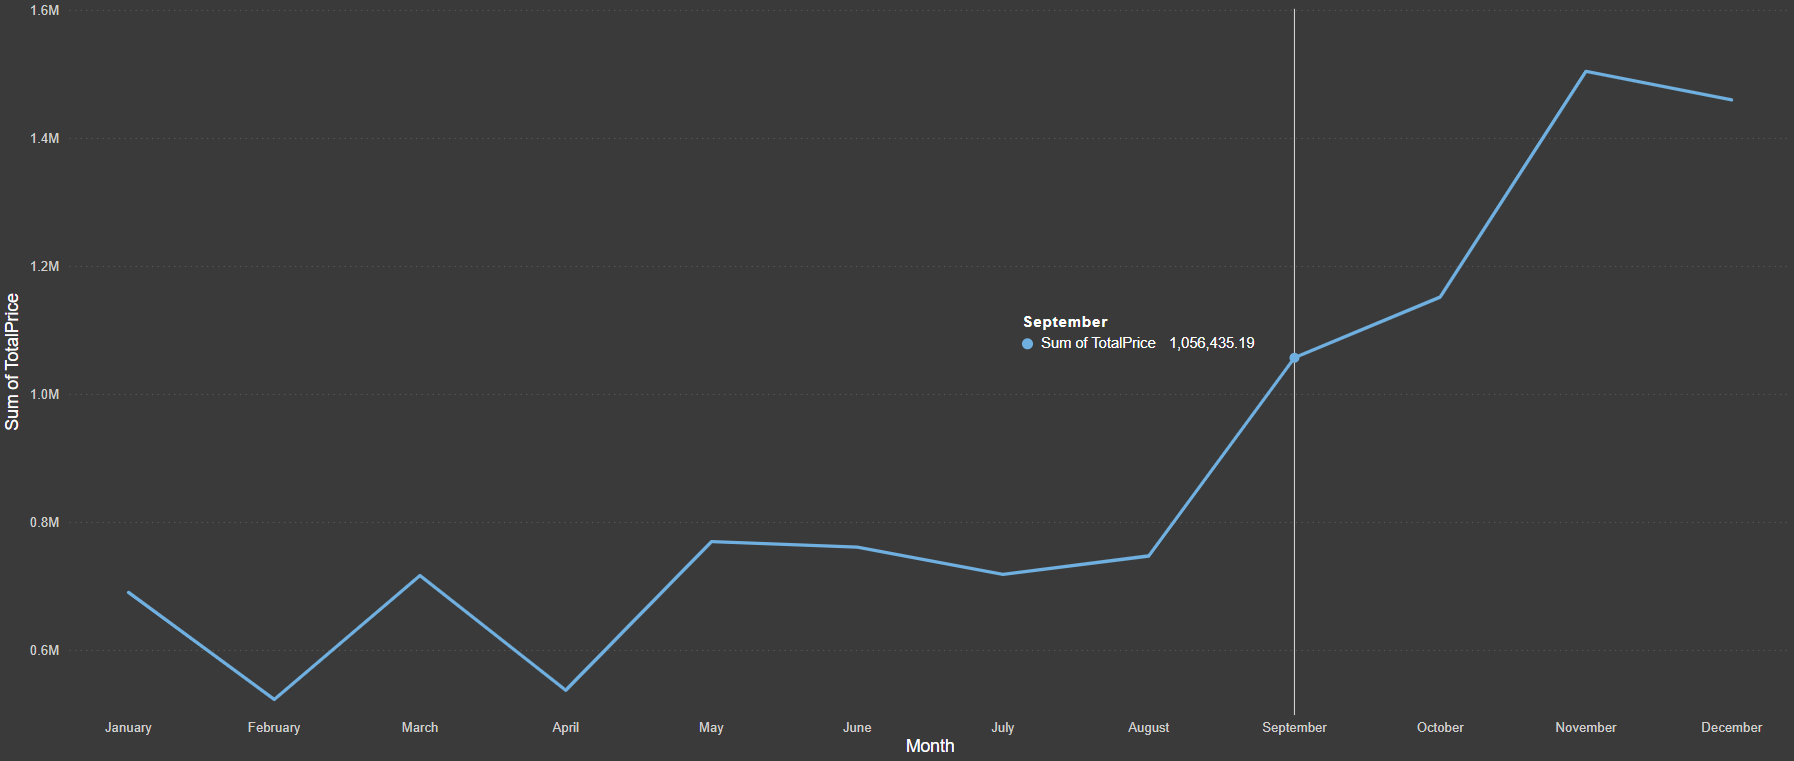
automated cleaning, a Loan Portfolio Dashboard for risk assessment in Power BI, and an Online Retail Purchase
Patterns Dashboard analyzing customer behavior and sales trends. Each project taught me how to handle data quality
issues, work with large datasets, and explain technical findings to non-technical stakeholders. What gets me
excited is using data to solve real problems. Right now I'm expanding my knowledge in financial analytics and
looking for opportunities where I can leverage my technical skills and problem-solving abilities in an entry-level
Data Analyst role.
I'm also building Closr, a real estate marketplace startup that brings listings, vetted service providers, and secure payments into one trusted platform. Outside of Closr, I write on Substack under "An Opinion & A Pen", my blog for sharing thoughts on politics, society, and anything on my mind. I'm interested in how AI tools can solve real problems. For more details on my experience and skills, check out my resume below.